NoSQL DB 이면서 검색엔진인 Elasticsearch 8 설정의 작업 과정을 기록합니다.
- Elasticsearch 작업하기 - 1일차 : es, kibana 설치 ✔
- Elasticsearch 작업하기 - 2일차 : nori plugin, mecab-co 설치
1. Elasticsearch 개요
1) 라이센스
- 오픈소스이지만, 소스를 수정하여 상업적으로 서비스 하는 것은 막았다.
- 7.10.2 까지만 허용되고 7.11 부터의 버전은 클라우드 금지
- 제품 또는 서비스의 일부분으로 검색엔진으로서 사용되는 것은 가능
- 검색 서비스를 개발하는데는 별 지장 없다.
2) 제품 구성
- Elasticsearch : 검색 엔진, 플러그인
- JVM 이 빌트인 되어 설치된다. 보통 Java 17 이상
- Kibana : elastic 관리 및 쿼리 도구
- node 모듈로 구성
- Logstash : 데이터 입력용 ETL 도구
- MetricBeats : 성능 모니터링 (Kibana 대시보드에서 조회)
3) 보안 설정
- elasticsearch 8.x 에서는 자동으로 ssl 생성과 https 설정이 이루어짐
- kibana 는 설치시 es 접속을 위한 증명서를 받아와 사용한다.
- elastic 슈퍼 유저가 기본 계정으로 생성되고, role 과 계정을 추가할 수 있다.
- metric 정보 조회 등의 api 를 위해서 api-key 발급 기능도 있다.
2. Elasticsearch 설치
1) MacOS 에서 homebrew 로 설치 (최신 버전이 7.17.4)
기본 설정으로 작동시키는 것은 성공했지만, 부팅 후 자동실행 설정에 실패했다.
- MacOS 의 launchctl 을 열심히 만져봤지만, 실패
- 사용자 계정으로 등록도 시켜보고, system 계정으로도 해봤다.
1
2
3
4
5
6
7
8
9
10
11
12
13
14
15
16
17
18
19
20
21
22
23
24
25
26
27
28
29
30
31
$ brew tap elastic/tap
$ brew install elastic/tap/elasticsearch-full

Data:    /usr/local/var/lib/elasticsearch/elasticsearch_bgmin/
Logs:    /usr/local/var/log/elasticsearch/elasticsearch_bgmin.log
Plugins: /usr/local/var/elasticsearch/plugins/
Config:  /usr/local/etc/elasticsearch/

To start elastic/tap/elasticsearch-full now and restart at login:
  brew services start elastic/tap/elasticsearch-full
==> Summary
🍺  /usr/local/Cellar/elasticsearch-full/7.17.4: 946 files, 476.2MB, built in 5 seconds

$ export ES_JAVA_HOME=$JAVA17_HOME
$ export ES_TMPDIR="/tmp/es_temp"
$ export ES_HOME="/usr/local/Cellar/elasticsearch-full/7.17.4"
$ export ES_PATH_CONF="/usr/local/etc/elasticsearch"
# ==> `ES_PATH_CONF=/path/to/my/config ./bin/elasticsearch -d -p pid`

$ cd $ES_HOME
$ ./bin/elasticsearch -d -p pid
$ ./bin/elasticsearch-setup-passwords interactive
You will be prompted to enter passwords as the process progresses.
Please confirm that you would like to continue [y/N] y

Enter password for [elastic]:
Enter password for [apm_system]:
Enter password for [kibana_system]:
Enter password for [logstash_system]:
Enter password for [beats_system]:
Enter password for [remote_monitoring_user]:
2) Ubuntu 에서 apt 로 설치
서비스 자동실행를 위해 Ubuntu 의 systemctl 을 사용하는 것이 가장 믿음직스러워 설치를 재시도 했다. docker 에 비해 시스템 튜닝의 변경이 바로 반영된다는 편리함이 있지만, single node 라는 점이 염려되었다. elasticsearch 는 가용성을 중시하기 때문에 샤딩과 복제 메커니즘을 가지고 있다. 최소 3개 이상의 멀티 노드의 구조에서 장점을 발휘하는데, single node 인 경우 샤딩에 관한 선택의 여지가 없게된다. (shard_size=1)
- 장점: 설치 후 유지보수가 편한다. (서버 관리, 데이터 관리)
- 단점: 샤딩이 안되고, 리소스 낭비가 크다. (서버 1대에 서비스 1개)
- 클라우드 서비스를 사용하면 좋겠지만, 매우 비싸다
elasticsearch
설치 과정에서 elastic 계정과 토큰이 생성된다.
- elastic 계정 임의의 패스워드
- kibana 설치에 사용될 enrollment token (elastic 접속에 사용)
- kibana 웹 연결시 첫화면에 입력창에 넣을 값
1
2
3
4
5
6
7
8
9
10
11
12
13
14
15
16
17
18
19
20
21
22
23
24
25
26
27
28
29
30
31
32
33
34
35
$ sudo apt-get update && sudo apt-get install elasticsearch

━━━━━━━━━━━━━━━━━━━━━━━━━━━━━━━━━━━━━━━━━━━━━━━━━━━━━━━━━━━━━━━━━━━━━━━━
✅ Elasticsearch security features have been automatically configured!
✅ Authentication is enabled and cluster connections are encrypted.

ℹ️  Password for the elastic user (reset with `bin/elasticsearch-reset-password -u elastic`):
  c-lY6Lt82-Bn3-40tX8u

ℹ️  HTTP CA certificate SHA-256 fingerprint:
  1aeac2438fb1998f6a4780a********e5be0987ccccbd278f1e1

ℹ️  Configure Kibana to use this cluster:
• Run Kibana and click the configuration link in the terminal when Kibana starts.
• Copy the following enrollment token and paste it into Kibana in your browser (valid for the next 30 minutes):
  eyJ2ZXIiOiI4L*********IwMCJdLCJmZ3IiOiIxYWVhYzI0MzhmYjE5OThmNmE0NzgwYWYxNDk5NzRjOTI3OGQzNDdhZDMyZTViZTA5ODdjY2NjYmQ************5IjoiMUdzRHFzeDV2dTc6Sndhc1ZLU01Say1MbXJxRjVBYk40QSJ9

ℹ️  Configure other nodes to join this cluster:
• On this node:
  ⁃ Create an enrollment token with `bin/elasticsearch-create-enrollment-token -s node`.
  ⁃ Uncomment the transport.host setting at the end of config/elasticsearch.yml.
  ⁃ Restart Elasticsearch.
• On other nodes:
  ⁃ Start Elasticsearch with `bin/elasticsearch --enrollment-token <token>`, using the enrollment token that you generated.
━━━━━━━━━━━━━━━━━━━━━━━━━━━━━━━━━━━━━━━━━━━━━━━━━━━━━━━━━━━━━━━━━━━━━━━━━━

$ sudo systemctl daemon-reload
$ sudo systemctl enable elasticsearch.service
$ sudo systemctl start elasticsearch.service

# (실행 상태에서) elastic 슈퍼유저의 패스워드 변경
$ sudo /usr/share/elasticsearch/bin/elasticsearch-reset-password -i -u elastic

# curl 접속 테스트
$ curl -k -XGET "https://localhost:9200" -u elastic:{password}
💡TIP : curl 사용시
- 패스워드에 특수기호를 사용한 경우
\를 붙여서 입력하면 된다. - https 접속시
-k옵션을 사용
아래 내용이 elasticsearch.yml 에 자동으로 설정된다.
1
2
3
4
5
6
7
8
9
10
11
12
13
14
15
16
17
18
19
20
21
22
23
24
25
26
27
28
29
30
31
32
33
34
35
36
#------------- BEGIN SECURITY AUTO CONFIGURATION -------------
#
# The following settings, TLS certificates, and keys have been automatically
# generated to configure Elasticsearch security features on 24-03-2023 10:20:39
#
# ------------------------------------------------------------

# Enable security features
xpack.security.enabled: true

xpack.security.enrollment.enabled: true

# Enable encryption for HTTP API client connections, such as Kibana, Logstash, and Agents
xpack.security.http.ssl:
  enabled: true
  keystore.path: certs/http.p12

# Enable encryption and mutual authentication between cluster nodes
xpack.security.transport.ssl:
  enabled: true
  verification_mode: certificate
  keystore.path: certs/transport.p12
  truststore.path: certs/transport.p12
# Create a new cluster with the current node only
# Additional nodes can still join the cluster later
cluster.initial_master_nodes: ["${HOSTNAME}"]

# Allow HTTP API connections from anywhere
# Connections are encrypted and require user authentication
http.host: 0.0.0.0

# Allow other nodes to join the cluster from anywhere
# Connections are encrypted and mutually authenticated
#transport.host: 0.0.0.0

#--------- END SECURITY AUTO CONFIGURATION ----------
추가 작업
SSD 외장 드라이브(M.2 NVMe)로 데이터와 로그 경로를 설정하였다.
- elasticsearch.yml 에서 path.data 와 path.logs 수정
- 이미 데이터가 생성된 경우 폴더를 복사해서 적용한다
1
2
3
4
5
6
7
8
9
10
# 마음의 평화를 위해 777 모드를 적용한다. (이거 안하면 elasticsearch 동작 실패함)
$ sudo chmod -Rv 777 /mnt/ssd1t/

# elasticsearch 를 위한 data, logs 폴더 생성
$ sudo mkdir -p /mnt/ssd1t/elasticsearch/data
$ sudo mkdir -p /mnt/ssd1t/elasticsearch/logs
$ sudo chown -R elasticsearch:elasticsearch /mnt/ssd1t/elasticsearch

# 서비스 재시작
$ sudo systemctl restart elasticsearch.service
설치 후 브라우저로 https://localhost:9200 접속하여 확인
참고문서
- Storing Elasticsearch Data on a Separate Ubuntu Partition
- How can I safely move Elasticsearch indices to another mount in Linux?
kibana
elasticsearch 에 비해 설치 과정이 손쉽다.
- kibana 설치
- elasticsearch 에 등록 (연결)
- https 설정
1
2
3
4
5
6
7
# 설치
$ sudo apt-get install kibana

# 서비스 시작
$ sudo systemctl daemon-reload
$ sudo systemctl enable kibana.service
$ sudo systemctl start kibana.service
브라우저로 http://localhost:5601 접속하여 다음 과정을 진행
1
2
3
4
5
# 우선 elasticsearch 접속을 위한 token 생성
$ sudo /usr/share/elasticsearch/bin/elasticsearch-create-enrollment-token -s kibana

# kibana 접속 후 확인 코드 입력
$ sudo /usr/share/kibana/bin/kibana-verification-code
설치를 마치면, kibana.yml 에 아래 내용이 추가되어 있다.
1
2
3
4
5
# This section was automatically generated during setup.
elasticsearch.hosts: ['https://${HOSTNAME}:9200']
elasticsearch.serviceAccountToken: AAEAAWVsYXN0aWMva2li*********kxRQnlablFUcnJXaEx5UQ
elasticsearch.ssl.certificateAuthorities: [$KIBANA_HOME/data/ca_1679653377606.crt]
xpack.fleet.outputs: [{id: fleet-default-output, name: default, is_default: true, is_default_monitoring: true, type: elasticsearch, hosts: ['https://${HOSTNAME}:9200'], ca_trusted_fingerprint: 1aeac2438fb1998f6*********8d347ad32e5be0987ccccbd278f1e1}]
추가작업 : SSL 설정
https 로 접속하도록 설정하려면, cert 정보를 생성해야 한다.
1
2
3
4
5
6
7
$ sudo openssl genrsa -des3 -out server.key 2048
$ sudo openssl rsa -in server.key -out server.key
$ sudo openssl req -new -key server.key -out server.csr
$ sudo openssl x509 -req -days 365 -in server.csr -signkey server.key -out server.crt

$ sudo mkdir /etc/kibana/certs
$ sudo mv server.* /etc/kibana/certs/
kibana.yml 에 cert 파일을 등록한다.
1
2
3
server.ssl.enabled: true
server.ssl.certificate: /etc/kibana/certs/server.crt
server.ssl.key: /etc/kibana/certs/server.key
브라우저로 https://localhost:5601 접속하여 확인
metricbeat
MetricBeat 설치 문서를 참고해서 진행하면 된다.
- Install Metricbeat on the same server as Elasticsearch
1
2
3
4
5
6
7
- module: elasticsearch
  xpack.enabled: true
  period: 10s
  hosts: ["https://localhost:9200"]
  #hosts: ["http://localhost:9200"]
  #username: "user"
  #password: "secret"
- Enable and configure the Elasticsearch x-pack module in Metricbeat
ES접속 정보를 설정 (나중에 계정 대신에 api_key로 교체)
1
2
3
4
5
6
7
8
9
10
11
12
# ------------------ Elasticsearch Output ------------------
output.elasticsearch:
  # Array of hosts to connect to.
  hosts: ["https://localhost:9200"]

  # Protocol - either `http` (default) or `https`.
  #protocol: "https"

  # Authentication credentials - either API key or username/password.
  #api_key: "id:api_key"
  username: "elastic"
  password: "changeme"
- Configure Metricbeat to send data to the monitoring cluster
설정 사항을 테스트할 수 있다.
1
2
3
4
5
6
7
8
9
10
11
12
13
14
15
16
17
18
19
20
21
$ ./metricbeat test config
Config OK
$ ./metricbeat test output
elasticsearch: https://localhost:9200...
  parse url... OK
  connection...
    parse host... OK
    dns lookup... OK
    addresses: ::1, 127.0.0.1
    dial up... OK
  TLS...
    security: server's certificate chain verification is enabled
    handshake... OK
    TLS version: TLSv1.3
    dial up... OK
  talk to server... OK
  version: 8.6.2
$ sudo ./metricbeat -e
Index setup finished.
Loading dashboards (Kibana must be running and reachable)
# 꽤 시간 걸림 (3분?)
- Start Metricbeat
1
2
3
4
5
6
$ sudo ./metricbeat -e
Exiting: error loading config file: config file ("metricbeat.yml") must be owned by the user identifier (uid=0) or root

$ sudo chown root metricbeat.yml
$ sudo chown root modules.d/{modulename}.yml
$ ./metricbeat -e --strict.perms=false
- 추가작업 : api_key 등록
1
2
3
4
5
6
7
8
9
10
11
12
13
14
15
16
17
18
19
20
21
22
23
24
25
# Kibana > DevTools > Console
PUT /_security/api_key/grant
{
  "grant_type": "password",
  "username": "metric",
  "password": "1234567890",
  "api_key": {
    "name": "metric"
  }
}
# ==>
{
  "id": "tWznFocB870DDqsxdAUJ",
  "name": "metric",
  "api_key": "Trp5LcLKRpCCAsxsGb_27w",
  "encoded": "dFd6bkZvY0I4NzBERHFzeGRBVUo6VHJwNUxjTEtScENDQXN4c0diXzI3dw=="
}
# username & password 대신에 api_key="id:api" 를 사용
# ==> OUTPUT_ES_API_KEY="tWznFocB870DDqsxdAUJ:Trp5LcLKRpCCAsxsGb_27w"

$ ./metricbeat keystore add OUTPUT_ES_API_KEY
The keystore does not exist. Do you want to create it? [y/N]: y
Created keystore
Enter value for OUTPUT_ES_API_KEY: <붙여넣기>
Successfully updated the keystore
elastic 계정 대신에 api_key 를 사용하도록 설정한다.
1
2
3
4
5
6
7
8
# ------------------ Elasticsearch Output ------------------
output.elasticsearch:
  hosts: ["localhost:9200"]
  protocol: "https"

  # Authentication credentials - either API key or username/password.
  # api_key: "id:api_key"
  api_key: "${OUTPUT_ES_API_KEY}"
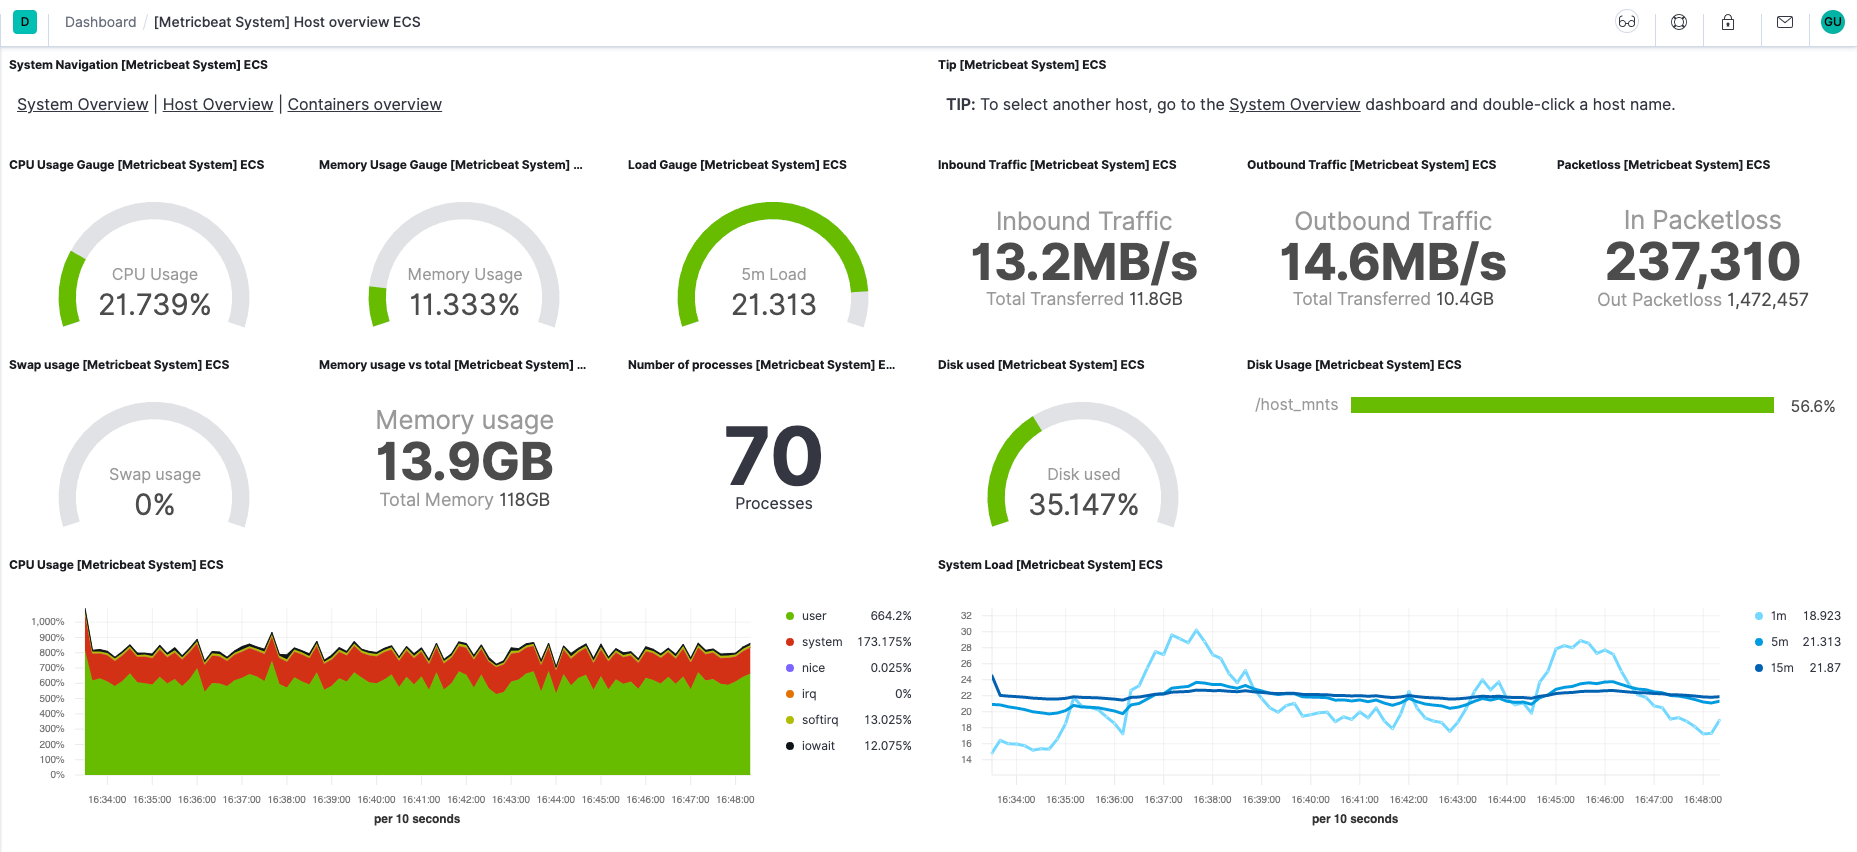
- Kibana 대시보드로 metricbeat 기본 템플릿 조회
- Stack Management > Index Management > Data Streams
- metricbeat-8.6.2 항목 확인 (head=yellow, indices=1)
- Analytics > Dashboard > [Metricbeat System] Overview ECS
- Analytics > Discover 에서 “metricbeat-“ 스트림 확인
- Observability > Overview 에서 host 선택
3. 도메인 인증서와 nginx 연동
외부에서 elasticsearch API 를 이용하려면 도메인 설정을 하는 것이 좋다.
1) certbot 으로 도메인 인증서 발급
search.example.com 이라 가정하고, ssl 인증서를 발급하자.
2) ssl 을 적용하여 nginx 에 연동
같은 방식으로 kibana 도 연동할 수 있다.
1
2
3
4
5
6
7
8
9
10
11
12
13
14
15
16
17
18
server {
    listen 443 ssl;
    server_name search.example.com;

    ssl_certificate /etc/letsencrypt/live/search.example.com/fullchain.pem;
    ssl_certificate_key /etc/letsencrypt/live/search.example.com/privkey.pem;
    include /etc/letsencrypt/options-ssl-nginx.conf;
    ssl_dhparam /etc/letsencrypt/ssl-dhparams.pem;

    location / {
        proxy_set_header Host $http_host;
        proxy_set_header X-Real-IP $remote_addr;
        proxy_set_header X-Forwarded-For $proxy_add_x_forwarded_for;
        proxy_set_header X-Forwarded-Proto $scheme;
        proxy_set_header X-NginX-Proxy true;
        proxy_pass https://localhost:9200;
    }
}
server.basePath 를 적용하고, 아래와 같이 설정하고 싶었지만 실패!
https://api.example.com/search에 elasticsearch 를 맵핑https://api.example.com/admin에 kibana 를 맵핑
Stackoverflow 에 관련 질문들이 많이 올라와 있다. 생각대로 작동하지 않는다는 내용이 다수이고, basePath 를 사용하기 위해서는 url 에서 basePath 문자열을 필터링 후 제거하여 basePath 가 반복되지 않도록 rewrite 처리를 해야 한다는 답변이 있다.
9. Review
- 시스템 설정에 너무 시간을 빼앗겼다. 핵심에 집중하자.
- 그런데 찜찜한 부분이 있으면 그냥 넘어가질 못하겠다. 아무래도 Docker 설치도 하게 될 듯
끝! 읽어주셔서 감사합니다.