AgensGraph 모니터링을 위해 Prometheus 와 Grafana 설정과 성능지표 쿼리를 작성합니다.
postgres_exporter는 postgresql 데이터베이스의 성능지표를 수집하여 Prometheus에게 전달하는 Agent 프로그램입니다. Prometheus와 마찬가지로 go 언어로 작성되어 있고, 다양한 OS를 지원합니다. exporter는 Prometheus와 함께 연동되며, Grafana 처럼 대시보드를 제공하는 다른 시각화 도구와 함께 사용됩니다.
Prometheus
Prometheus는 오픈소스 성능 모니터링 도구입니다. 수집되는 성능지표(metrics)들을 지속적으로 수집하고 저장하며, 수식(expr) 설정으로 Alert 기능도 수행하고, API 제공과 간단한 그래프 출력도 수행합니다. 성능지표들은 Prometheus가 직접 수집하는 것은 아니고 exporter라는 개별 Agent들을 상대로 endpoint를 주기적으로 읽어오는(pull) 방식으로 작동합니다. 기본 포트는 9090입니다.
Prometheus 의 exporters 들
- Node-exporter
- kube-state-metrics
- Actuator (jmx-exporter)
- cAdvisor (docker-container)
- mysql-exporter
- wmi-exporter (window server)
- postgresql-exporter
- redis-exporter
- mongodb-exporter
- elasticsearch-exporter
- kafka-exporter
- 등등..
prometheus 설정 파일
prometheus를 간단히 brew install prometheus로 설치할 수 있는데, 설정파일은 아래 위치에 있습니다.
1
2
3
4
5
6
7
8
9
10
11
12
13
$ cat /opt/homebrew/etc/prometheus.args
--config.file /opt/homebrew/etc/prometheus.yml
--web.listen-address=127.0.0.1:9090
--storage.tsdb.path /opt/homebrew/var/prometheus

$ cat /opt/homebrew/etc/prometheus.yml
global:
  scrape_interval: 15s

scrape_configs:
  - job_name: "prometheus"
    static_configs:
    - targets: ["localhost:9090"]
postgres_exporter
현재 최신 버전은 0.10.1 이고, Postgresql 9.4 부터 13 버전까지 지원합니다. 기본 포트는 9187을 사용합니다.
postgres_exporter 작동
1
2
3
4
5
6
7
8
9
10
11
# 필수 환경변수 (일반적인 dsn 형식)
$ export DATA_SOURCE_NAME="postgresql://${PG_UID}:${PG_PWD}@${HOST_IP}:${PORT}/${DATABASE}?sslmode=disable"

# queries.yaml 에는 사용자 정의 성능지표를 작성할 수 있다 (왠만한거 다 있음)
# postgres_exporter를 상시 운용할 때에는 서비스로 등록하는게 만사 편하다
$ ./postgres_exporter --extend.query-path=queries.yaml --log.level=info
ts=2022-03-17T11:48:17.851Z caller=main.go:135 level=info msg="Listening on address" address=:9187
ts=2022-03-17T11:48:17.851Z caller=tls_config.go:195 level=info msg="TLS is disabled." http2=false
ts=2022-03-17T11:48:30.068Z caller=server.go:74 level=info msg="Established new database connection" fingerprint=minubt:5432
ts=2022-03-17T11:48:30.098Z caller=postgres_exporter.go:645 level=info msg="Semantic version changed" server=minubt:5432 from=0.0.0 to=10.4.0
..
postgres_exporter 의 metrics 출력 내용
정상 작동하는지 확인하기 위해 localhost:9187/metrics를 열어보면 자잘한 항목들이 출력됩니다. 이후 ‘새로고침’을 할 때마다 데이터가 변경되면 정상입니다.
출력 내용은 다음과 같은 항목의 연속입니다.
HELP는 metric description 을 출력TYPE은 Prometheus 에서 사용될 형태(usage)의 타입pg_로 시작하는 metric 이름과 값 출력
1
2
3
4
5
6
7
8
9
10
11
12
13
...
# HELP pg_settings_zero_damaged_pages Continues processing past damaged page headers.
# TYPE pg_settings_zero_damaged_pages gauge
pg_settings_zero_damaged_pages{server="minubt:5432"} 0
# HELP pg_stat_activity_count number of connections in this state
# TYPE pg_stat_activity_count gauge
pg_stat_activity_count{datname="metastore",server="minubt:5432",state="active"} 0
pg_stat_activity_count{datname="metastore",server="minubt:5432",state="disabled"} 0
pg_stat_activity_count{datname="metastore",server="minubt:5432",state="fastpath function call"} 0
pg_stat_activity_count{datname="metastore",server="minubt:5432",state="idle"} 0
pg_stat_activity_count{datname="metastore",server="minubt:5432",state="idle in transaction"} 0
pg_stat_activity_count{datname="metastore",server="minubt:5432",state="idle in transaction (aborted)"} 0
...
Prometheus 에 postgres_exporter 의 endpoint 등록하기
1
2
3
4
5
6
7
8
9
10
11
12
13
$ cat /opt/homebrew/etc/prometheus.yml
global:
  # 15초 간격으로 읽어오기
  scrape_interval: 15s

scrape_configs:
  - job_name: "prometheus"
    static_configs:
    - targets: ["localhost:9090"]
  # postgres_exporter 등록하기
  - job_name: "postgres_exporter"
    static_configs:
    - targets: ["localhost:9187"]
postgres_exporter 의 metrics 목록
postgres_exporter는 외부파일 queries.yaml로 사용자 정의된 항목과 내부에 설정되어 있는 항목으로 metrics를 출력하고 있습니다. 대부분 postgresql 에서 제공하는 성능정보를 사용합니다. 관련 내용은 ‘PG 문서’를 참조하세요.
| Metric Set | Metric | Usage | Field Desc. |
| pg_database | pg_database_size_bytes | gauge | Disk space used by the database |
| postgres_exporter.go | pg_static | untyped | Version string as reported by postgres |
| pg_exporter_last_scrape_duration_seconds | gauge | Duration of the last scrape of metrics from PostgreSQL. | |
| pg_exporter_last_scrape_error | gauge | Whether the last scrape of metrics from PostgreSQL resulted in an error (1 for error, 0 for success). | |
| pg_exporter_scrapes_total | counter | Total number of times PostgreSQL was scraped for metrics. | |
| pg_exporter_user_queries_load_error | gauge | Whether the user queries file was loaded and parsed successfully (1 for error, 0 for success). | |
| pg_up | gauge | Whether the last scrape of metrics from PostgreSQL was able to connect to the server (1 for yes, 0 for no). | |
| pg_locks | pg_locks_count | gauge | Number of locks |
| pg_postmaster | pg_postmaster_start_time_seconds | gauge | Time at which postmaster started |
| pg_process_idle | pg_process_idle_seconds_bucket pg_process_idle_seconds_sum pg_process_idle_seconds_count | histogram | Idle time of server processes |
| pg_replication | pg_replication_lag | gauge | Replication lag behind master in seconds |
| pg_scrape (collector.go) | pg_scrape_collector_duration_seconds | gauge | postgres_exporter: Duration of a collector scrape. |
| pg_scrape_collector_success | gauge | postgres_exporter: Whether a collector succeeded. | |
| pg_settings (pg_setting.go) | pg_settings_allow_null_properties | gauge | Enables the insertion of null properties into vertices and edges |
| ~ | ~ | (pg_settings 의 내용, 278개) | |
| pg_settings_zero_damaged_pages | gauge | Continues processing past damaged page headers. | |
| pg_stat_activity | pg_stat_activity_count | gauge | number of connections in this state |
| pg_stat_activity_max_tx_duration | gauge | max duration in seconds any active transaction has been running | |
| pg_stat_archiver | pg_stat_archiver_archived_count | counter | Number of WAL files that have been successfully archived |
| pg_stat_archiver_failed_count | counter | Number of failed attempts for archiving WAL files | |
| pg_stat_archiver_last_archive_age | gauge | Time in seconds since last WAL segment was successfully archived | |
| pg_stat_bgwriter (pg_stat_bgwriter.go) | pg_stat_bgwriter_buffers_alloc_total | counter | Number of buffers allocated |
| pg_stat_bgwriter_buffers_backend_fsync_total | counter | Number of times a backend had to execute its own fsync call (normally the background writer handles those even when the backend does its own write) | |
| pg_stat_bgwriter_buffers_backend_total | counter | Number of buffers written directly by a backend | |
| pg_stat_bgwriter_buffers_checkpoint_total | counter | Number of buffers written during checkpoints | |
| pg_stat_bgwriter_buffers_clean_total | counter | Number of buffers written by the background writer | |
| pg_stat_bgwriter_checkpoint_sync_time_total | counter | Total amount of time that has been spent in the portion of checkpoint processing where files are synchronized to disk, in milliseconds | |
| pg_stat_bgwriter_checkpoint_write_time_total | counter | Total amount of time that has been spent in the portion of checkpoint processing where files are written to disk, in milliseconds | |
| pg_stat_bgwriter_checkpoints_req_total | counter | Number of requested checkpoints that have been performed | |
| pg_stat_bgwriter_checkpoints_timed_total | counter | Number of scheduled checkpoints that have been performed | |
| pg_stat_bgwriter_maxwritten_clean_total | counter | Number of times the background writer stopped a cleaning scan because it had written too many buffers | |
| pg_stat_bgwriter_stats_reset_total | counter | Time at which these statistics were last reset | |
| pg_stat_database_conflicts | pg_stat_database_conflicts | counter | Number of queries canceled due to conflicts with recovery in this database. (Conflicts occur only on standby servers; see pg_stat_database_conflicts for details.) |
| pg_stat_database_conflicts_confl_bufferpin | counter | Number of queries in this database that have been canceled due to pinned buffers | |
| pg_stat_database_conflicts_confl_deadlock | counter | Number of queries in this database that have been canceled due to deadlocks | |
| pg_stat_database_conflicts_confl_lock | counter | Number of queries in this database that have been canceled due to lock timeouts | |
| pg_stat_database_conflicts_confl_snapshot | counter | Number of queries in this database that have been canceled due to old snapshots | |
| pg_stat_database_conflicts_confl_tablespace | counter | Number of queries in this database that have been canceled due to dropped tablespaces | |
| pg_stat_database | pg_stat_database_blks_read | counter | Number of disk blocks read in this database |
| pg_stat_database_blks_hit | counter | Number of times disk blocks were found already in the buffer cache, so that a read was not necessary (this only includes hits in the PostgreSQL buffer cache, not the operating system's file system cache) | |
| pg_stat_database_blk_read_time | counter | Time spent reading data file blocks by backends in this database, in milliseconds | |
| pg_stat_database_blk_write_time | counter | Time spent writing data file blocks by backends in this database, in milliseconds | |
| pg_stat_database_deadlocks | counter | Number of deadlocks detected in this database | |
| pg_stat_database_numbackends | gauge | Number of backends currently connected to this database. This is the only column in this view that returns a value reflecting current state; all other columns return the accumulated values since the last reset. | |
| pg_stat_database_stats_reset | counter | Time at which these statistics were last reset | |
| pg_stat_database_temp_bytes | counter | Total amount of data written to temporary files by queries in this database. All temporary files are counted, regardless of why the temporary file was created, and regardless of the log_temp_files setting. | |
| pg_stat_database_temp_files | counter | Number of temporary files created by queries in this database. All temporary files are counted, regardless of why the temporary file was created (e.g., sorting or hashing), and regardless of the log_temp_files setting. | |
| pg_stat_database_tup_deleted | counter | Number of rows deleted by queries in this database | |
| pg_stat_database_tup_fetched | counter | Number of rows fetched by queries in this database | |
| pg_stat_database_tup_inserted | counter | Number of rows inserted by queries in this database | |
| pg_stat_database_tup_returned | counter | Number of rows returned by queries in this database | |
| pg_stat_database_tup_updated | counter | Number of rows updated by queries in this database | |
| pg_stat_database_xact_commit | counter | Number of transactions in this database that have been committed | |
| pg_stat_database_xact_rollback | counter | Number of transactions in this database that have been rolled back | |
| ETC | postgres_exporter_build_info | gauge | A metric with a constant '1' value labeled by version, revision, branch, and goversion from which postgres_exporter was built. |
| promhttp_metric_handler_requests_in_flight | gauge | Current number of scrapes being served. | |
| promhttp_metric_handler_requests_total | counter | Total number of scrapes by HTTP status code. |
지표 pg_stat_statements가 안나오는 경우
postgres_exporter에서 지원하지만 사용 불가능한 지표 그룹으로 ‘pg_stat_statements’가 있습니다. 이것은 pg_stat_statements 익스텐션에 의해 작동되는 pg의 stat 기능인데, 일반 배포버전에는 pg_stat_statements 익스텐션이 없어서 기능하지 못합니다. (contrib 버전만 되는듯)
${PG_HOME}/share/extension아래에 내용 확인- 없으면
postgres_exporter의queries.yaml에서pg_stat_statements항목을 주석처리 하세요
- 없으면
- 참고 Postgresql 13 - pg_stat_statements 설치 및 사용방법
Prometheus 연동
queries.yaml 에 metric 추가하기
- Prometheus의 queries.yaml 파일에 metrics 설정을 추가하는 것만으로도 작동 가능
- usage 타입이 GAUGE, COUNT 등 수치형이어야 출력 되는 내용이 생김
- Label 타입은 항목명의 추가 속성으로 출력 → 필터링 조건으로 사용
1) 접속한 DB의 graphname 과 사용 용량(테이블 용량의 합산)을 출력
1
2
3
4
5
6
7
8
9
10
11
12
13
14
15
16
17
18
19
20
21
22
23
24
25
26
27
28
29
30
ag_graphs:
  query: |
    SELECT
        g.nspid as gr_oid,
        g.graphname as gr_name,
        pg_catalog.pg_get_userbyid(nspowner) as gr_owner,
        sum(
            pg_total_relation_size(quote_ident(g.graphname) ||
            '.' || quote_ident(t.tablename))
            )::bigint as gr_volm
    FROM
        pg_catalog.ag_graph g
        LEFT JOIN pg_catalog.pg_namespace n on n.nspname = g.graphname
        LEFT JOIN pg_tables t on t.schemaname = g.graphname
    GROUP BY
        gr_oid, gr_name, gr_owner
    ORDER BY g.nspid
  metrics:
    - gr_oid:
        usage: "LABEL"
        description: "OID of graph"
    - gr_name:
        usage: "LABEL"
        description: "Name of graph"
    - gr_owner:
        usage: "LABEL"
        description: "Name of graph owner"
    - gr_volm:
        usage: "GAUGE"
        description: "Estimated number of graph volume"
2) 특정 graph의 label 리스트와 데이터 개수(size)와 용량(volume) 출력
- SQL 내에
g.graphname = 'sample_graph'처럼 graph_path 를 명시 - 주기적으로 실행되므로, DB에 부담을 주는 쿼리는 사용하지 말 것을 권장함
pg_stat_user_tables는 PG가 제공해주는 통계로 성능 부담이 없다
1
2
3
4
5
6
7
8
9
10
11
12
13
14
15
16
17
18
19
20
21
22
23
24
25
26
27
28
29
30
31
32
33
34
35
36
37
38
39
ag_sample_graph:
  query: |
    SELECT
        l.labid as la_oid,
        l.labname as la_name,
        case when l.labkind='e' then 'edge' else 'vertex' end as la_type,
        pg_catalog.pg_get_userbyid(c.relowner) as la_owner,
        pg_total_relation_size(
            concat( g.graphname::varchar, concat( '.'::varchar, l.labname::varchar ))
            ) as la_volm,
        coalesce(null, u.n_live_tup, 0) as la_size
    FROM
        pg_catalog.ag_label l
        INNER JOIN pg_catalog.ag_graph g ON g.oid = l.graphid
        LEFT OUTER JOIN pg_catalog.pg_class c ON c.oid = l.relid
        LEFT OUTER JOIN pg_stat_user_tables u on u.relid = l.relid
    WHERE
        g.graphname = 'sample_graph'
        and l.labname not in ('ag_vertex', 'ag_edge')
    ORDER BY l.labid
  metrics:
    - la_oid:
        usage: "LABEL"
        description: "OID of label"
    - la_name:
        usage: "LABEL"
        description: "Name of label"
    - la_type:
        usage: "LABEL"
        description: "Type of label (vertex or edge)"
    - la_owner:
        usage: "LABEL"
        description: "Name of label owner"
    - la_volm:
        usage: "GAUGE"
        description: "Estimated number of label volume"
    - la_size:
        usage: "COUNTER"
        description: "Number of label record"
Prometheus 쿼리
Grafana 연동
이것 역시 brew install grafana로 손쉽게 설치할 수 있습니다. 기본 포트는 3000입니다.
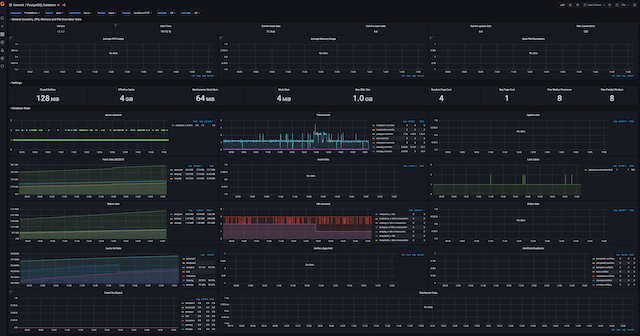
Postgresql Dashboard
- 브라우저로
localhost:3000을 열고 Configuration > Dashboard에 Prometheus를 등록HTTP > URL항목 :http://localhost:9090
Create > Import에 레이아웃 json 파일 추가- 고맙게도 Postgresql Dashboard 레이아웃이 제공되고 있다.
- Datasource 로 Prometheus 를 설정
- Postgresql DB Stats 매트릭스들
- Active Session, Idle Session
- Transaction, Update data, Fetch data, Insert data, Delete data
- Lock tables, Conflicts
- Return data
- Cache Hit rate
- Temp file, 등등..
Grafana 대시보드 작성
- 새로운 dashboard 를 create 하고
- panel 추가
- panel 에 prometheus 의 query 를 작성
- ex)
ag_sample_graph_la_size{la_type="vertex"} offset 30m- la_type=”vertex” 필터링 후 30분 단위로 잘라서 출력
- ex)
- 그 외 필요한 차트 스타일, 제목 등을 편집
- ex)
Legend=””- 차트 legend를 la_name 값으로 표기
- ex)
AgensGraph 대시보드에 사용된 쿼리
- Graph별 용량 (MB단위)
- ag_graphs_gr_volm{gr_desc=””} offset 30m / (1024*1024)
- Label별 사이즈(개수)
- ag_sample_graph_la_size{la_type=”vertex”} offset 30m
- Label별 용량(KB단위)
- ag_sample_graph_la_volm{la_type=”edge”} offset 30m / (1024)
Grafana 개발 관련 참고사항
React Plugin 개발
Grafana의 대시보드를 컴포넌트 형태로 외부에서 사용할 방법은 없다. 대신에 Grafana 프레임워크를 기반으로 필요한 Component를 Plugin 형태로 개발하는 것은 가능하다. 또, AngularJS 에 의한 Plugin 개발은 폐기(deprecated) 되었음.
- plugin 위치: ${GRAFANA_ROOT}/share/grafana/public/app/plugins/panel
- 참고 문서
끝! 읽어주셔서 감사합니다.