Python 환경에서 그래프 분석을 하기 위해 그래프의 시각화를 제공하는 graphvis 라이브러리에 대해 공부합니다.
graphviz 프로그램
graphviz는 그래프 시각화(graph visualization)를 위한 layout 계산기이다.
그래프 node 의 position 을 layout 알고리즘을 통해 출력한다.
matplotlib 등의 프로그램에서 graphviz 의 pos 결과를 받아 사용하는 형태이다.
- pygraphviz는
graphviz의 파이썬 라이브러리이다.
파이썬 그래프 라이브러리 networkx에도 기본적인 layout 알고리즘들이 있다.
보다 더 다양하고 적합한 layout 필요시에 graphviz 를 사용하게 된다.
MacOS 에서 pygraphviz 설치 오류
- ubuntu 의 경우 아무 문제 없이 잘 설치됨
- pygraphviz install guide
- MacOS 에서 graphviz 설치시 오류 발생
1
2
3
4
5
$ brew install graphviz
# <== 설치 오류

$ pip install pygraphviz
# <== (오류가 없어도 graphviz 가 제대로 설치 안되면 작동안됨)
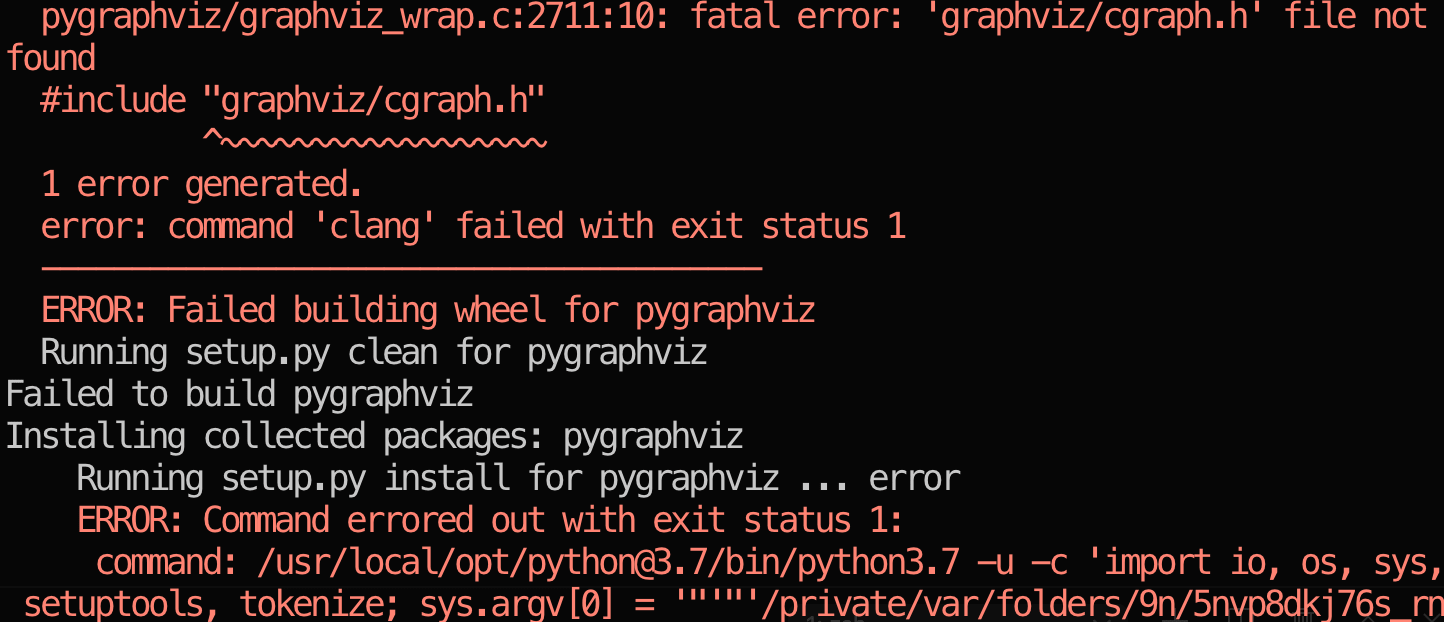 |
|---|
| <그림> pip install pygraphviz error |
PyGraphviz requires:
- Python (version 3.7, 3.8, or 3.9)
Graphviz <https://www.graphviz.org/>_ (version 2.42 or later)- C/C++ Compiler
graphviz 설치
- MacOS 의 개발도구 설치
xcode-select --install - graphviz-devel 설치
- 이후, graphviz 및 pygraphviz 설치
1
2
3
4
5
6
7
8
9
10
11
12
13
14
$ port install graphviz-devel

$ pip install --global-option=build_ext \
                  --global-option="-I/opt/local/include/" \
                  --global-option="-L/opt/local/lib/" \
                  pygraphviz
/usr/local/lib/python3.7/site-packages/pip/_internal/commands/install.py:232: UserWarning: Disabling all use of wheels due to the use of --build-option / --global-option / --install-option.
  cmdoptions.check_install_build_global(options)
Collecting pygraphviz
  Using cached pygraphviz-1.7.zip (118 kB)
Skipping wheel build for pygraphviz, due to binaries being disabled for it.
Installing collected packages: pygraphviz
    Running setup.py install for pygraphviz ... done
Successfully installed pygraphviz-1.7
1
2
3
4
5
6
7
8
9
10
11
12
13
$ brew install graphviz

$ pip install pygraphviz
Collecting pygraphviz
  Downloading pygraphviz-1.7.zip (118 kB)
     |████████████████████████████████| 118 kB 1.1 MB/s
Building wheels for collected packages: pygraphviz
  Building wheel for pygraphviz (setup.py) ... done
  Created wheel for pygraphviz: filename=pygraphviz-1.7-cp37-cp37m-linux_x86_64.whl size=226756 sha256=cbf0c822579ce63454ad60d1bf246732ada823f1338083c584b99d5721d0c86c
  Stored in directory: /home/bgmin/.cache/pip/wheels/8c/bc/0c/ac35392b72556e75107ff610cb31b313e8471918a6d280e34c
Successfully built pygraphviz
Installing collected packages: pygraphviz
Successfully installed pygraphviz-1.7
pygraphviz 테스트
설치가 모두 끝났으면, pygraphviz 의 layout 을 사용해 보자
sample1
- graphviz_layout 의
neato사용
1
2
3
4
5
6
7
8
9
10
11
12
13
14
15
16
17
18
19
20
21
22
23
import matplotlib.pyplot as plt
import networkx as nx

# create graph
doc_G = nx.DiGraph()
# nodes: [(id, attr_dict), ..]
doc_G.add_nodes_from([ (e.id, label_color(e.attrs)) for e in nodes ])
# edges: [(src_id, dst_id, attr_dict), ..]
doc_G.add_edges_from([ (e.src, e.dst, e.attrs) for e in edges ])

# calc layout
from networkx.drawing.nx_agraph import graphviz_layout
# layouts:
#    neato, dot, twopi, circo, fdp, nop, acyclic,
#    gvpr, gvcolor, ccomps, sccmap, tred, sfdp, unflatten
pos = graphviz_layout(doc_G, prog="neato", args="")

# draw graph
plt.figure(figsize=(8, 8))
nx.draw(doc_G, pos, node_size=20, alpha=0.5, node_color="blue")
plt.axis("equal")
plt.show()
plt.close()
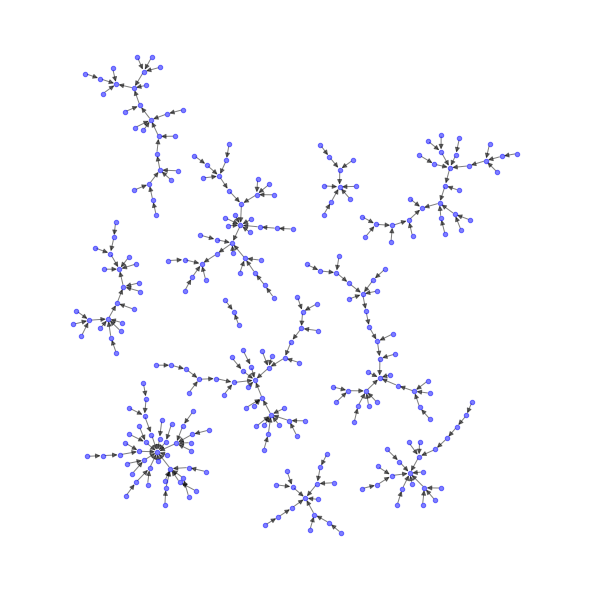 |
|---|
| <그림> pygraphviz-sample1 |
sample2
- graphviz_layout 의
dot사용 - node 그리기: color와 label을 함께 출력
- figure 에 title 출력
1
2
3
4
5
6
7
8
9
10
11
12
13
14
15
16
17
18
19
20
21
22
23
24
25
26
27
28
29
30
31
32
33
34
35
36
37
import networkx as nx
import matplotlib.pyplot as plt

# 참고: components 는 Graph() 에서만 작동 (나머지는 미구현 오류)
# components = list(nx.connected_components(G))
# print('components=', len(components))  #, components)
# nodelist = components[1]

s_idx = 5
nodelist = [ e.id for e in nodes if e.s_idx==s_idx ]
roots = { e.s_idx:e.id for e in nodes if e.edge_tag=='ROOT' }
print('root=', roots[s_idx], G.nodes[roots[s_idx]]['text'], G.nodes[roots[s_idx]]['label'])

# graphviz layout 수행
from networkx.drawing.nx_agraph import graphviz_layout
pos = graphviz_layout(G, prog="dot", args="")  # prog: neato, dot, twopi, fdp, sfdp
# https://networkx.org/documentation/stable/reference/drawing.html#layout
# pos = nx.kamada_kawai_layout(G)

# color[list] 와 label[dict] 준비
colors = [G.nodes[e]['color'] for e in nodelist]
labels = { e: G.nodes[e]['text'] for e in nodelist }

# new figure
fig = plt.figure(figsize=(10,10))

# nodes with color
nx.draw_networkx_nodes(G, pos, label='label', nodelist=nodelist, node_color=colors, node_size=50, alpha=0.6)
# labels on nodes (한글 출력시 font 설정)
nx.draw_networkx_labels(G, pos, labels, font_size=12, font_family='D2Coding')
# edges
nx.draw_networkx_edges(G, pos=pos, edgelist=G.edges(nodelist))

# draw figure
plt.title(f'dependency tree of {docid}', bbox={'facecolor': '0.8', 'pad': 5})
plt.show()
plt.close(fig)
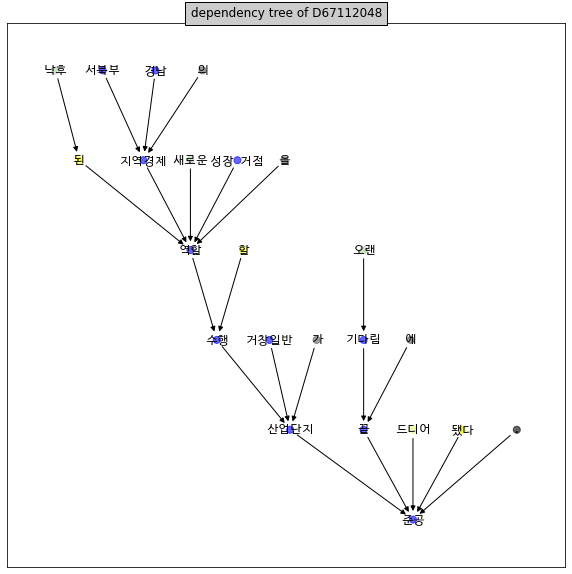 |
|---|
| <그림> pygraphviz-sample2 |
끝! 읽어주셔서 감사합니다.